David and David review David’s NRR analysis. What’s the recurrent theme?
• 5 minute read
By David Toms and David Issott
David Spitz’s excellent and thought-provoking analysis has been widely shared* (based on the number of people who’ve forwarded it onto me!) on social media, and sparked a discussion between me (David Toms, Head of Research) and David Issott, who heads our Hg Mercury funds:


It left us scratching our heads slightly. Not because we think it’s wrong (to be clear, we don’t), but because we’ve got one of the largest portfolios of software and services companies in the world, and although the trading backdrop has got more challenging in the last year or two, we aren’t seeing anything like these kinds of movements; our portfolio NRRs remain relatively stable. Why?
We’re acutely aware of the multiple challenges of reviewing and comparing NRR, from our own due diligence work on dozens of companies each year. What do you do with customers who lapse for a month, then restart – renewal or new business? What about those who take 20 pilot seats, then expand to 2,000 – upsell or new business? When looking at public companies, many companies do not publish the figures, and those companies that do, may not report comparably or be fully transparent about their methodologies.
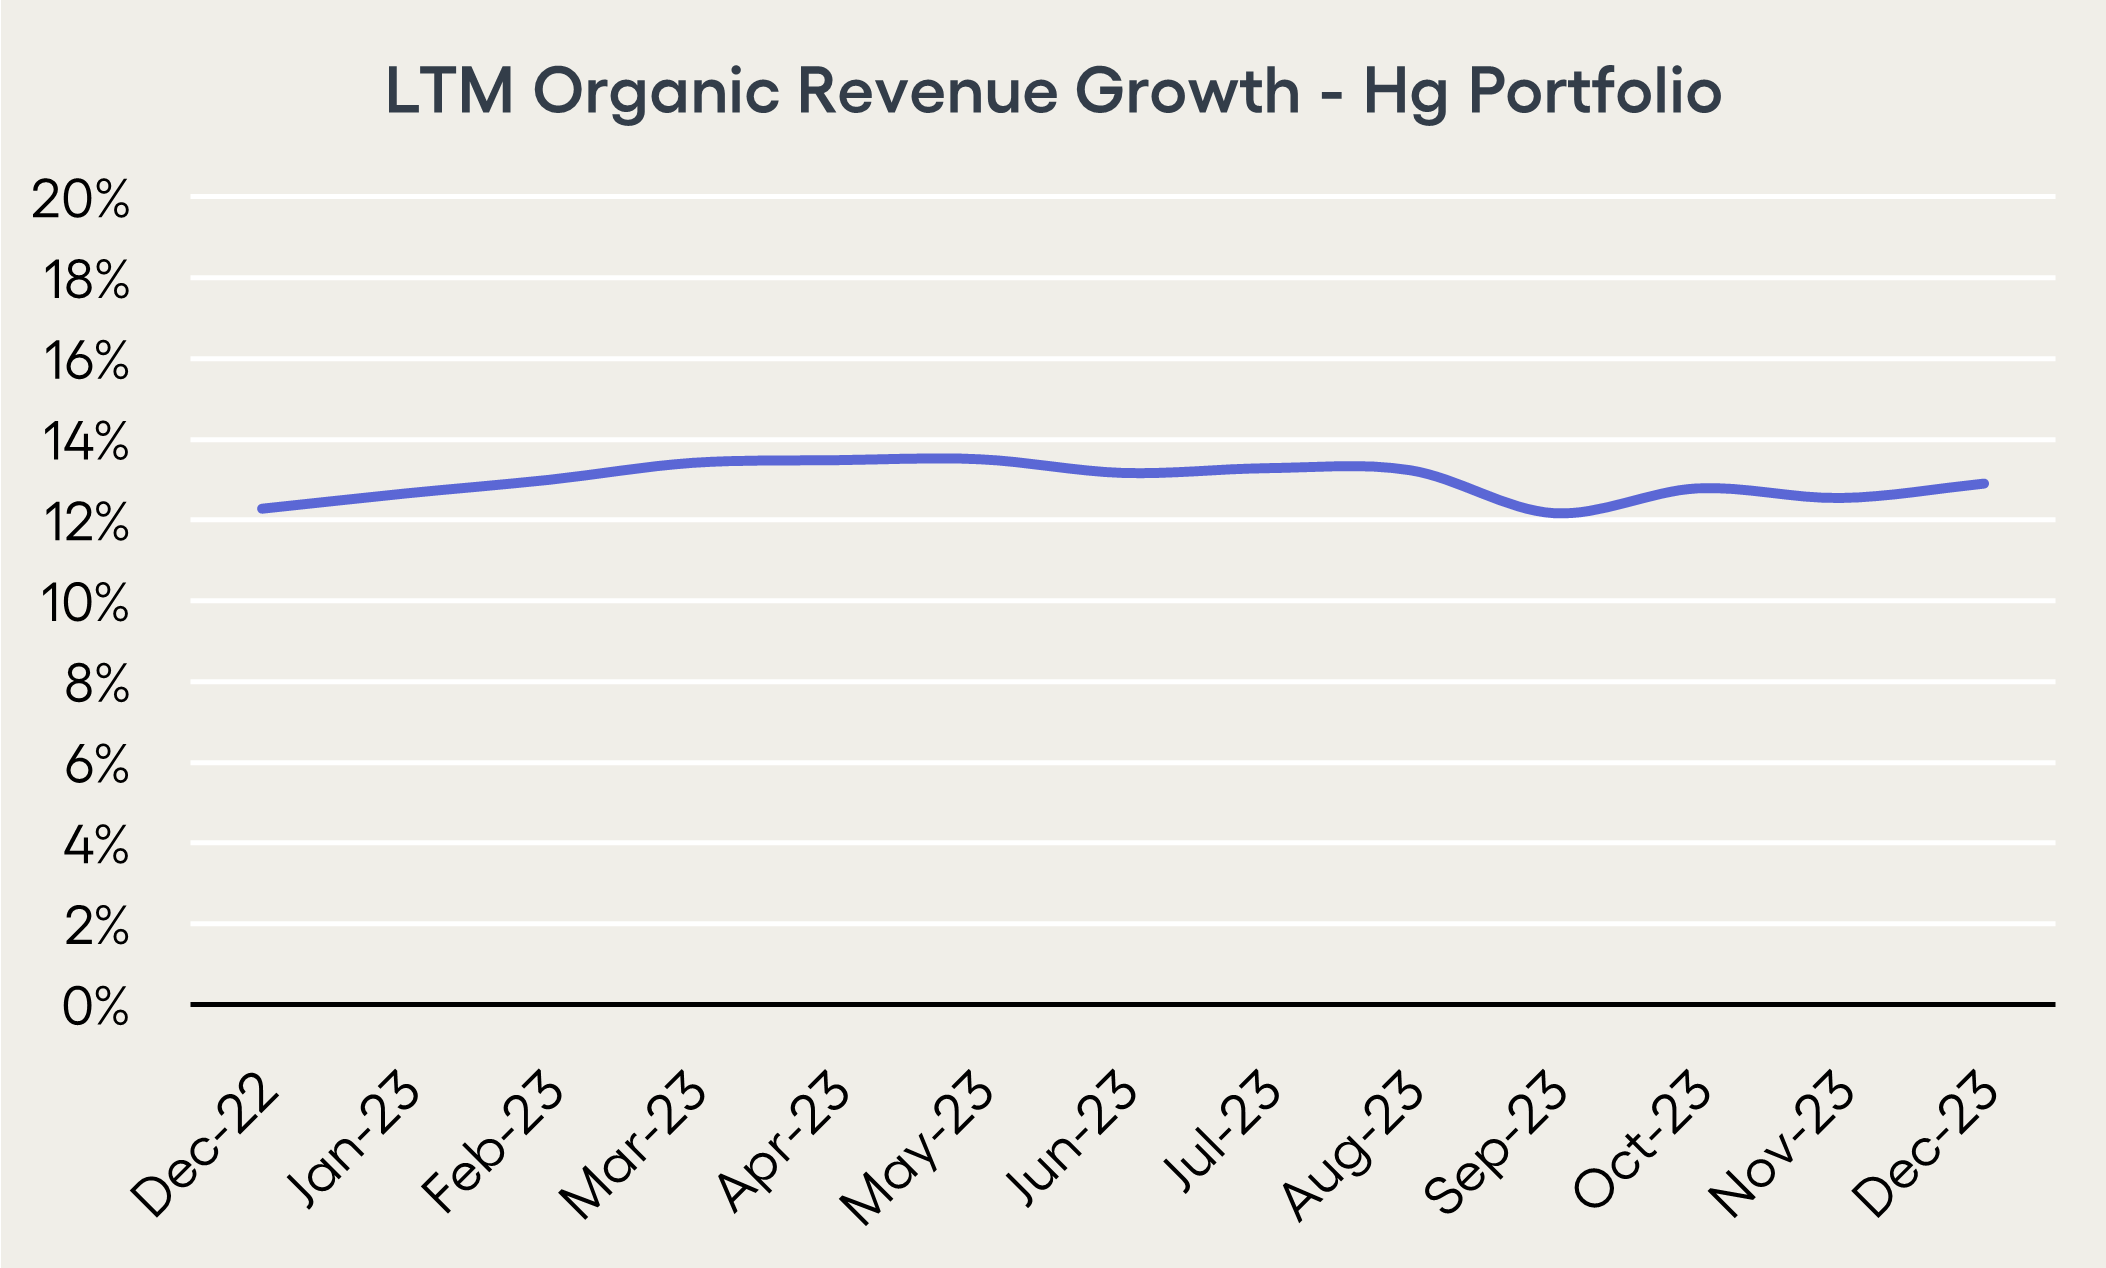
What we can easily look at, and compare, is revenue growth. It’s a bit of a lagging indicator compared to NRR, but directionally should be similar. To highlight why we were perplexed at the broader industry NRR slowdown, I’ve shown below our portfolio’s LTM organic revenue growth over the past year, to highlight how consistent the performance has been across approximately €20bn of sales. Clearly, we’ve not seen much in the way of revenue surprises. Bear in mind we do a lot of M&A, so our total revenue growth is around twice the organic growth rate shown, and a little more variable depending on timing of M&A. As at December 2023, our average LTM revenue growth rate including M&A was just over 20% vs the 12% organic figure.

So what is driving the slowdown in the public company world? To investigate, I’ve pulled together a dataset of c. 150 public software companies worth $6.4tn, with an aggregate $740bn of revenue.
First, in case anyone doubts my dedication to analysis, here’s an image of part of the underlying dataset (I know you can’t read the names – you think I share ALL my IP?!). This shows what analysts were expecting FY24/FY23 revenue growth to be, in each month, and how have those expectations changed. The colour coding represents, on a relative basis for each company, where the numbers are high vs low – clearly there is a preponderance of green on the left moving to red on the right, showing visually that forecasts reduced over the two year period. For example, back in March 2022, analysts were forecasting an FY24 revenue growth rate of 15% for Teamviewer. By February 2024, the same forecast for the same time period had dropped to 8% growth and so the shading for Teamview goes from green to red over the time period shown.


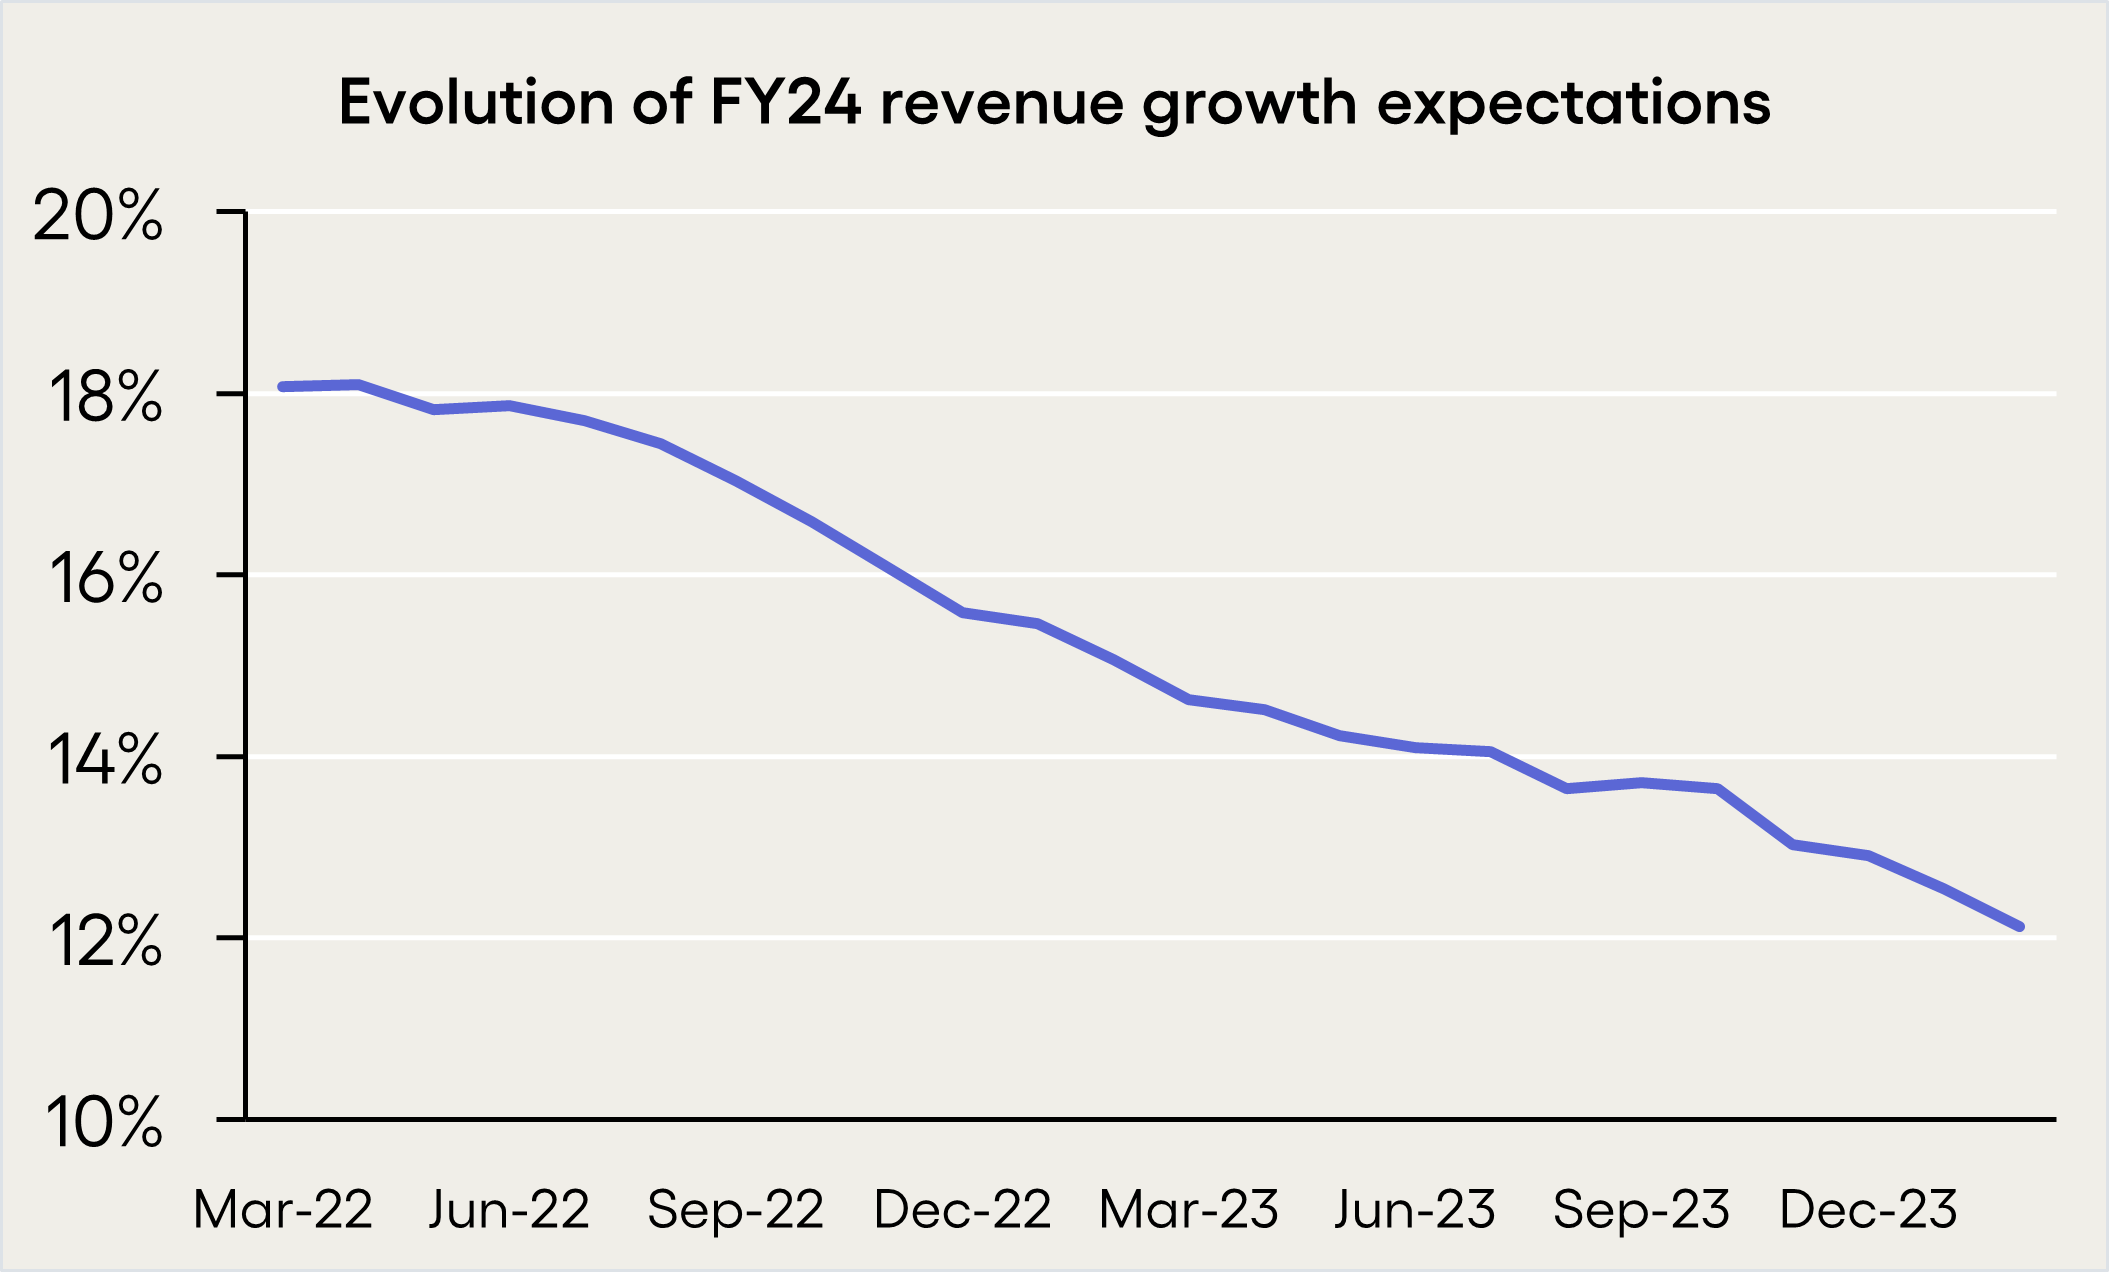
Aggregating these shows how 2024 revenue growth forecasts have changed numerically over the past two years, on a simple average basis. As of March 2022, analyst forecasts implied average revenue growth of 18% in FY24. By Feb 24, those expectations had dropped to just 12% growth. Note that simple averages like this tell you what the average company is seeing, which is not always the same as what the industry is seeing (for which a revenue-weighted average would be more appropriate).

How can it be that we are seeing such a divergence in the stability of performance between our portfolio and the public markets?
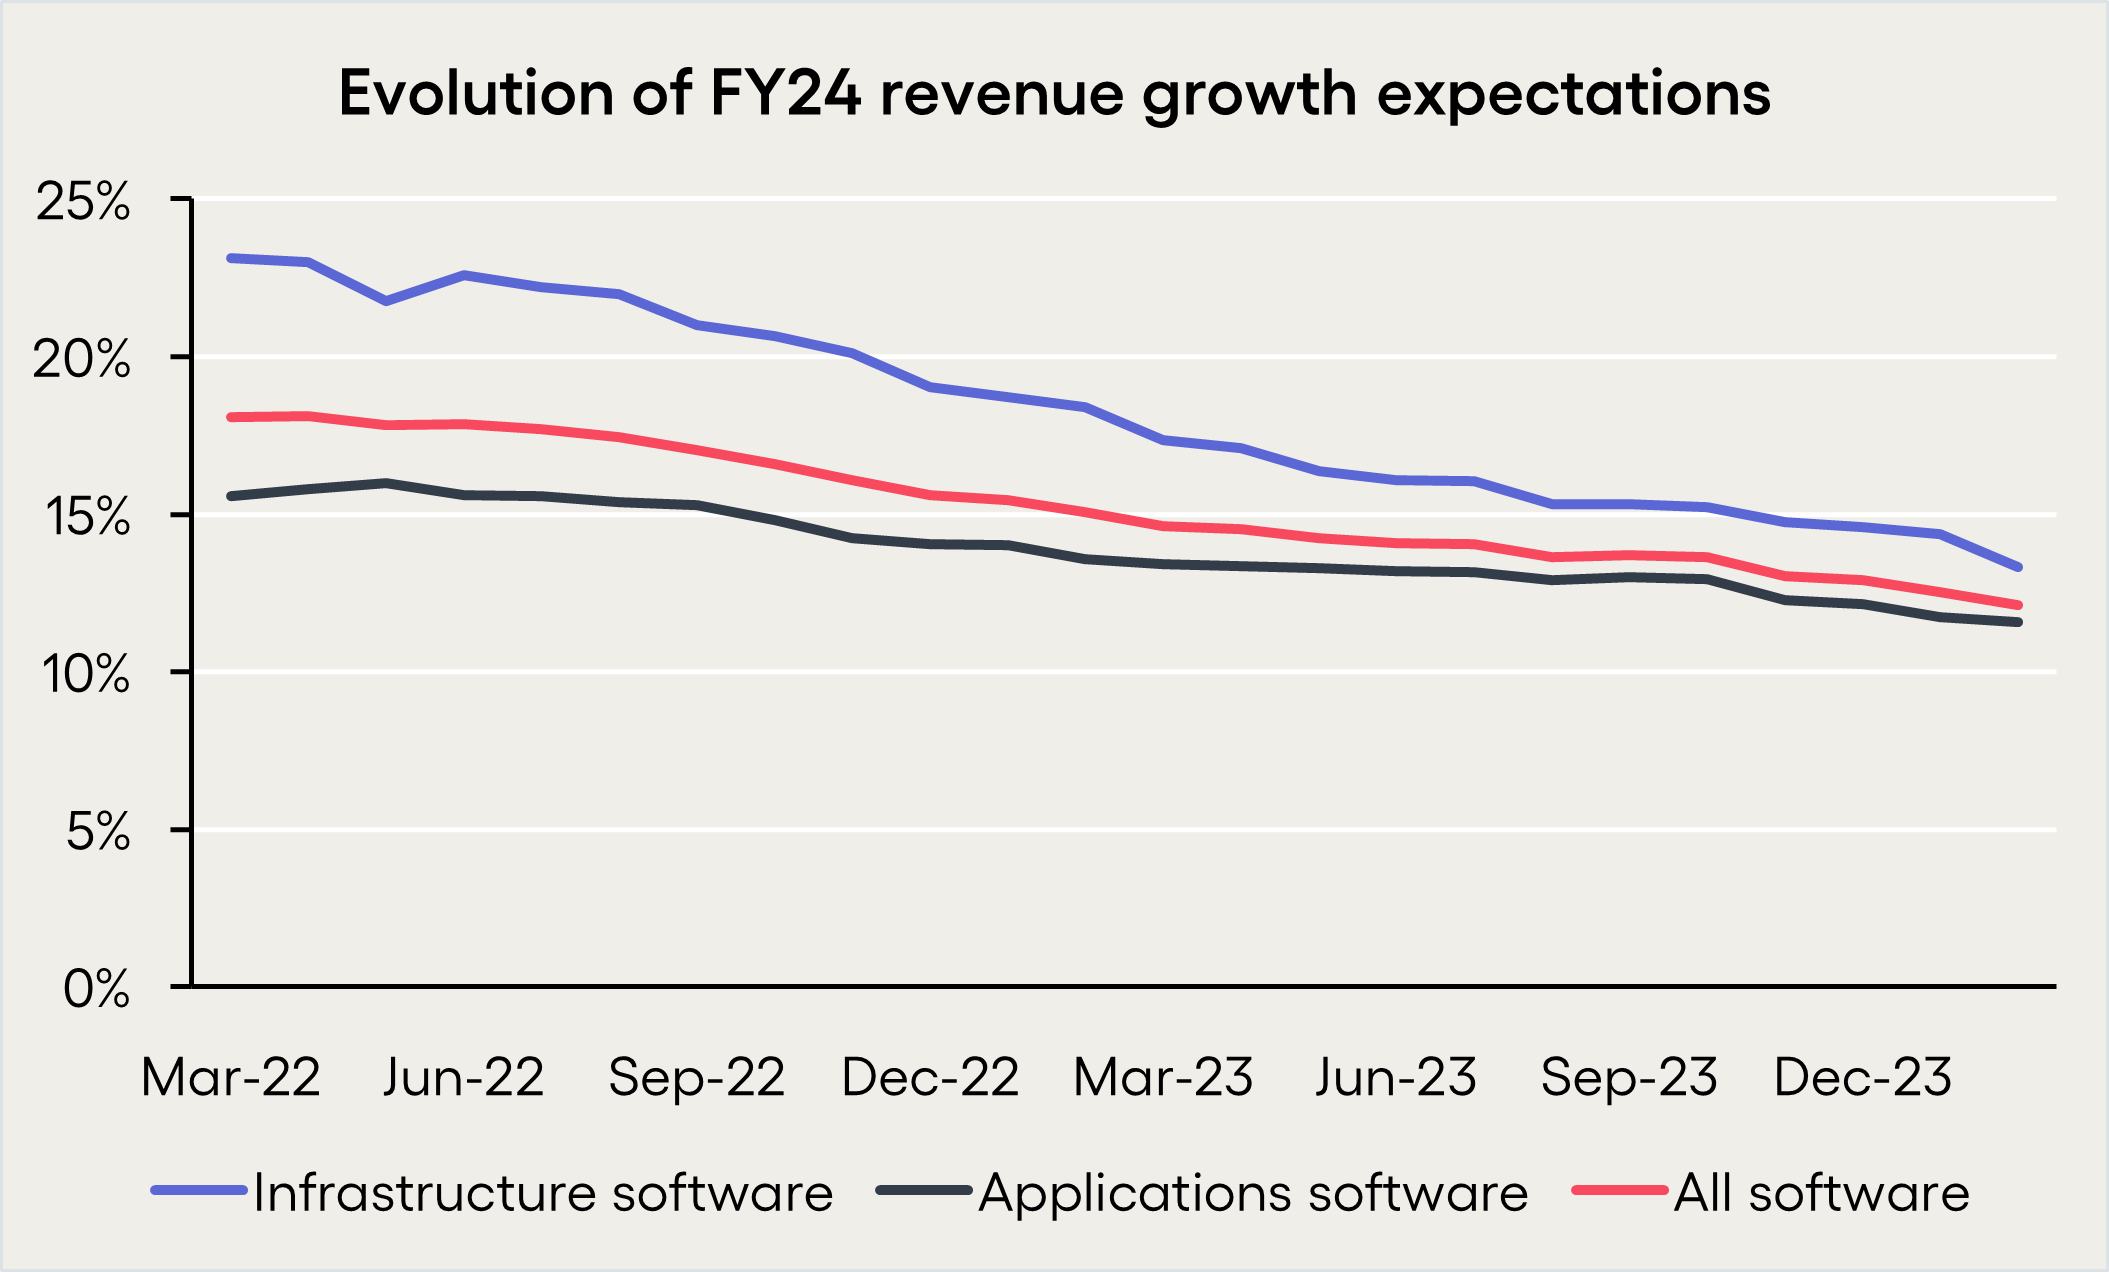
The names in the original list gave some clues. I would categorise many of these companies as “infrastructure software”, rather than the “application software” on which Hg focusses. It’s a slightly subjective definition, but broadly: infrastructure software tends to be purchased by IT professionals, and used to enhance the performance and operations of other software and hardware – it would include areas such as cybersecurity, databases and storage management. In contrast, application software is sold to business users, such as lawyers or HR professionals, to improve their workflows. It includes ERP and accounting software, HCM, legal workflow, capital markets software and the like. Clearly, there are blurred lines - for example, I think Box could be categorised in either (I went for infra, but wouldn’t fight someone who positioned it as a data sharing app), and giants like Oracle and Microsoft cover both infra and apps (I decided to go for apps in both cases). The size of the dataset means that a debatable classification or two has no material impact on the outcome.
This categorisation helps peel back the onion of sector performance. Infra has seen a ten percentage point drop in FY24 growth rate expectations (23% down to 13%), whereas application software has seen a mere four percentage point drop (16% to 12%). Amongst publicly listed software companies, both in absolute and relative terms, infrastructure software has seen about twice as much pain as application software.
The obvious question is why? If we look at third party data from well-regarded industry analysts, a consistent theme is that the software industry is, proportionately, one of the biggest consumers of IT (alongside the financial services industry). Furthermore, although I’ve not got any good third party data a layer deeper, I’m confident that there will be a further bias to infrastructure software within this – i.e. that the software industry consumes a disproportionately large amount of infrastructure software. Put another way - the fate of the infrastructure software industry is tied to… the fate of the software industry.
So in answer to the initial “Why?”, the upshot is that a small change in backdrop for the software industry has compounded to give a much larger change in backdrop for the infrastructure software segment. Meanwhile, application software is much less impacted, since it is driven by a long-term structural drive for greater workflow automation, with only a mild cyclical overlay from the broad economy. This predictability and robustness remains a key attraction for us, as investors in the sector. The software industry has become so large (as evidenced by the $740bn of revenue in my simple dataset alone) that looking at it as a single industry can mask some very different performances within.
Consistency has a value – we believe it enables us to continually deploy and re-deploy capital at higher returns both in platforms investments, and in accretive bolt ons. As Einstein never actually said, “Compounding remains the 8th Wonder of the World”, and everything we do to benefit from this, drives returns higher for longer.
Sources
Hg analysis/proprietary portfolio data.
Hg analysis of c. 150 publicly listed software companies representing approximately 75% of the total industry.